We use eddy covariance and vegetation remote sensing to investigate the seasonality of carbon cycling in native Eucalyptus woodlands near Sydney, as part of the Australian Terrestrial Ecosystem Research Network and OzFlux. Our data are available in the FluxNet2015 synthesis and from the OzFlux Data Portal, or feel free to contact us directly.
We also conduct regular surveys within a core-ha plot near the flux tower, which includes monitoring of standing tree biomass, understory species abundance and growth dynamics, leaf area and litter turnover, canopy phenology, and mistletoe infection status and associated tree mortality.
A Tale of Two Species: Complex Vegetation Structure Determined by Different Functional Types


Figure 1. Point cloud of Eucalyptus (left) and Melaleuca (right) inventory plots. Colour coding denotes to height above ground. (Metzen et al. in prep).

Figure 2. Vertical LiDAR return frequency of plots displayed in Fig. 1 & 2.

Figure 3. Basal area fraction of E. spp. (blue) and M. spp. (red) in the Cumberland plains.

Figure 4. Mistletoe infection classes surrounding CBLP flux tower (blue point). Linearly interpolated from leaf area estimates (0=<5%; 1=5-20%; 2=20-40%; 3=40-60%; 4=60-80%; 5=>80% mistletoe leaf area. (Griebel et al. in prep).
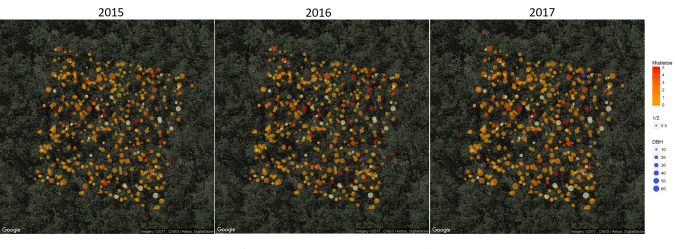
Figure 5. Standing tree biomass and associated mistletoe infection class in the core-ha. Each point represents a tree, the dot size indicates stem circumference and the color indicates mistletoe infection class (0=no mistletoe; 1=1-20%; 2=20-40%; 3=40-60%; 4=60-80%; 5=>80% mistletoe leaf area). Blue color indicates trees that died since the last survey. (Griebel et al. in prep).
Upside-down fluxes down under: Net carbon uptake in winter at Cumberland Plain

Figure 6. Time series of monthly fluxes, meteorology and canopy dynamics from 2014-2016. Partitioning based on SOLO in PFP. Vertical gray shading indicates summer and winter seasons (Renchon et al. 2018).

Figure 7. Diurnal trends of fluxes and drivers in summer and winter, 2014-2016. Curves indicate medians of data that passed quality controls. Seasonally averaged carbon fluxes based on PFP partitioning (Renchon et al., 2018)
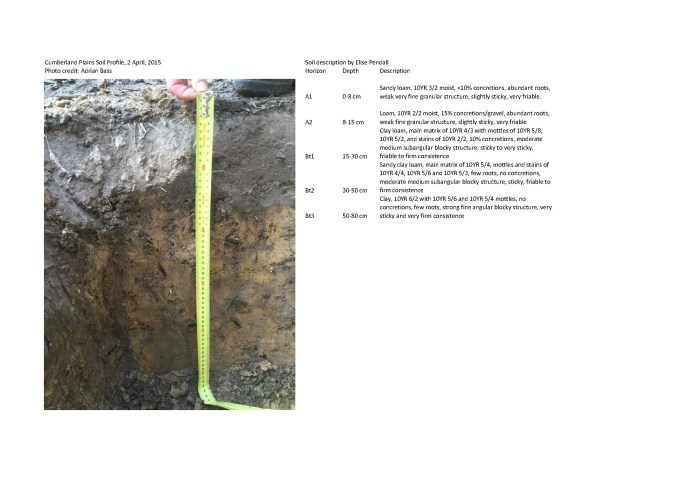
Figure 8. Soil characteristics near the CBLP flux tower, showing carbon-rich A horizon (3-5% C) with clay-rich B horizons. Mottling and iron concretions in A2 and Bt1 horizons indicate fluctuating redox conditions when water perches on the clay layer.
